
It’s no secret that France is a popular tourist destination for travelers around the world. We’ve taken a look into the latest reports and studies to combine the top France tourism statistics for 2024.
Key statistics about tourism in France:
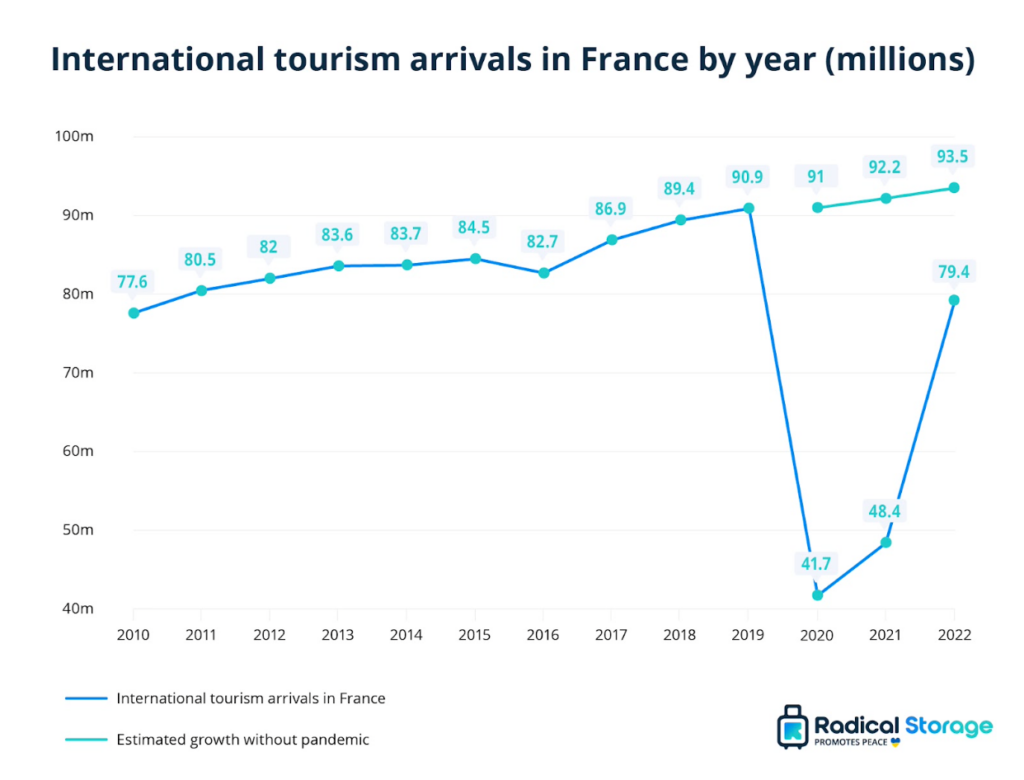
- Since 2010, France has received an average of 77.8 million international visitors each year, with 79.4 million in 2022.
- 2019 saw the highest number of international tourists in France, with 90.9 million people visiting the country.
- France is the most visited country in the world according to the U.N. with the USA coming in second.
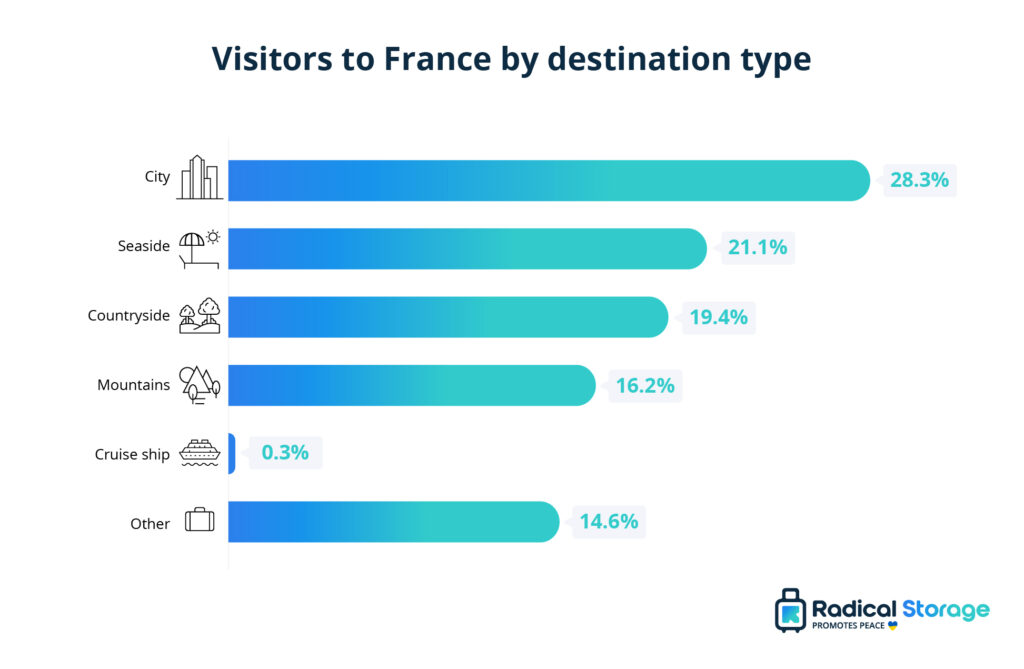
- The most popular destination type for visitors to France was a city, with 29.3% of tourists choosing a city location for their trip.
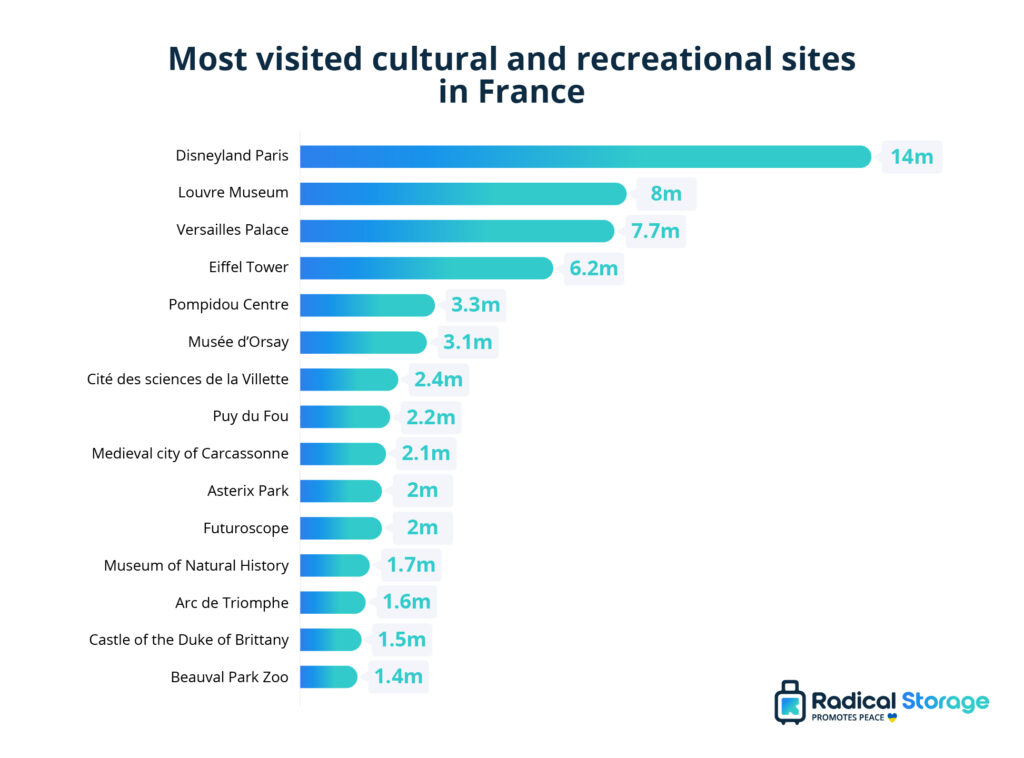
- Disneyland Paris is the most visited attraction in France with 14.8 million yearly visitors.
- France’s travel and tourism market size is expected to reach $20.03 billion in 2024, this is less than its European neighbors Spain ($26.21 billion) and Germany ($67.57 billion).
- Hotels make up the largest proportion of France’s travel and tourism market, with a projected market volume of $10.69 billion in 2024.
- In 2020, 134.6 million domestic tourists visited destinations in France, with 92.4% visiting for a leisure trip.
- Tourism accounts for 8% of France’s total GDP.
How many tourists visit France each year?
According to statistics from the U.N., France is the most visited country in the world with a peak of 90.9 visitors in 2019. This is followed by the USA with 79.3 million visitors in the same year. Between 2010 and 2022, France received an average of 77.8 million international overnight tourists per year.
Unsurprisingly, 2020 saw the lowest visitor numbers at 41.7 million due to travel restrictions during the COVID-19 pandemic. In 2022, tourism in France recovered with 79.4 million overnight visitors, a 64% increase compared to 2021’s 48.4 million overnight visitors.
| Year | International overnight tourism arrivals in France (millions) |
| Average per year since 2010 | 77.8 |
| 2022 | 79.4 |
| 2021 | 48.4 |
| 2020 | 41.7 |
| 2019 | 90.9 |
| 2018 | 89.4 |
| 2017 | 86.9 |
| 2016 | 82.7 |
| 2015 | 84.5 |
| 2014 | 83.7 |
| 2013 | 83.6 |
| 2012 | 82 |
| 2011 | 80.5 |
| 2010 | 77.6 |
Change in tourism to France over time
The number of international tourists visiting France maintained a steady increase between 2010 (77.6 million visitors) and 2019 (90.9 million visitors), with a slight drop in 2016 (82.7 million visitors).
Visitor numbers dropped by 54.1% in 2020 due to the pandemic. Since this drop in tourism in 2020, international visitor numbers to France recovered by 16.1% in 2021, when 48.4 million tourists visited the country. You can see in the graph what trend forecasting shows international arrivals would’ve looked like for France without the impact of the pandemic, with approximately 93.5 million in 2022.
France tourism market size
In 2024, France’s travel and tourism market is expected to reach $20.03 billion. Revenue in this sector is predicted to have a CAGR of 0.86% between 2024 and 2028, with revenue reaching $20.73 billion in 2028.
Hotels take the largest segment of this market with a predicted volume of $10.69 billion in 2024, with hotels in France expecting to see 26.08 million users by 2028. Tourism is worth 8% of France’s GDP.[2]
Within France’s travel and tourism market, online sales are predicted to generate 77% of total revenue by 2028.[2]
France has spent 1.96 billion Euros on rejuvenating tourism in the country after COVID-19 which plans to create 2 million jobs in the industry.[3]
Most visited tourist attractions in France
France is home to a wide variety of cultural and recreational sites which attract millions of visitors each year. The most visited place by far in France is Disneyland Paris with 14.8 million visitors per year. This is followed by the Louvre Museum with 8 million visitors and Versailles Palace with 7.7 million visitors. The Eiffel Tower receives 6.2 million visitors per year.
The most popular destinations for tourists in France
Using online search volumes for people searching from France, we have put together a list of the most popular tourist destinations for people living in France. The figures below are based on the average number of online searches per month for each attraction or destination.
Topping the list as the most popular attraction is Disneyland Paris, with an average monthly search volume of 450,000. The second most popular spot is Avignon with 144,000 monthly searches. Avignon is a city in France’s Provence region, once the seat of Catholic popes.
Other popular tourist attractions based on search volume include the tidal island Mont Saint Michel, the medieval citadel Carcassonne, and the port city of Le Havre in Normandy.
Trips by destination type
For those who visit France, there is a choice of destination types to choose from depending on the kind of trip you’d like to have. Of those who visited France in 2021, the most popular destination type was a city, with 28.3% choosing a city location. The next most popular was the seaside (21.1%), followed by the countryside (19.4%).
How long do people visit France for?
The number of nights an international visitor stays in France varies depending on a number of factors including where visitors are traveling from. The analysis below looks at international arrivals from the EU, the Americas, Asia, Africa, and Oceania.
People who travel from the EU are unsurprisingly the most likely to stay for only one night – also from the near London – with 17.2% of EU visitors staying in France for a night, however, the highest proportion of EU visitors (24.2%) stay for 4-6 days. Travelers from Africa are most likely to stay for longer periods with 57.1% staying in France for 7 days or more.
Domestic tourism statistics in France
Domestic tourism in France has followed a similar pattern to international tourism. Since 2012, domestic tourism expenditure has increased, peaking at €115.5 billion (EUR) in 2019, with a loss in 2020 to €58 billion. Since the pandemic, estimated figures show that domestic tourism expenditure in France recovered to €91.79 billion in 2021, with a slight drop to €89.2 billion in 2022.
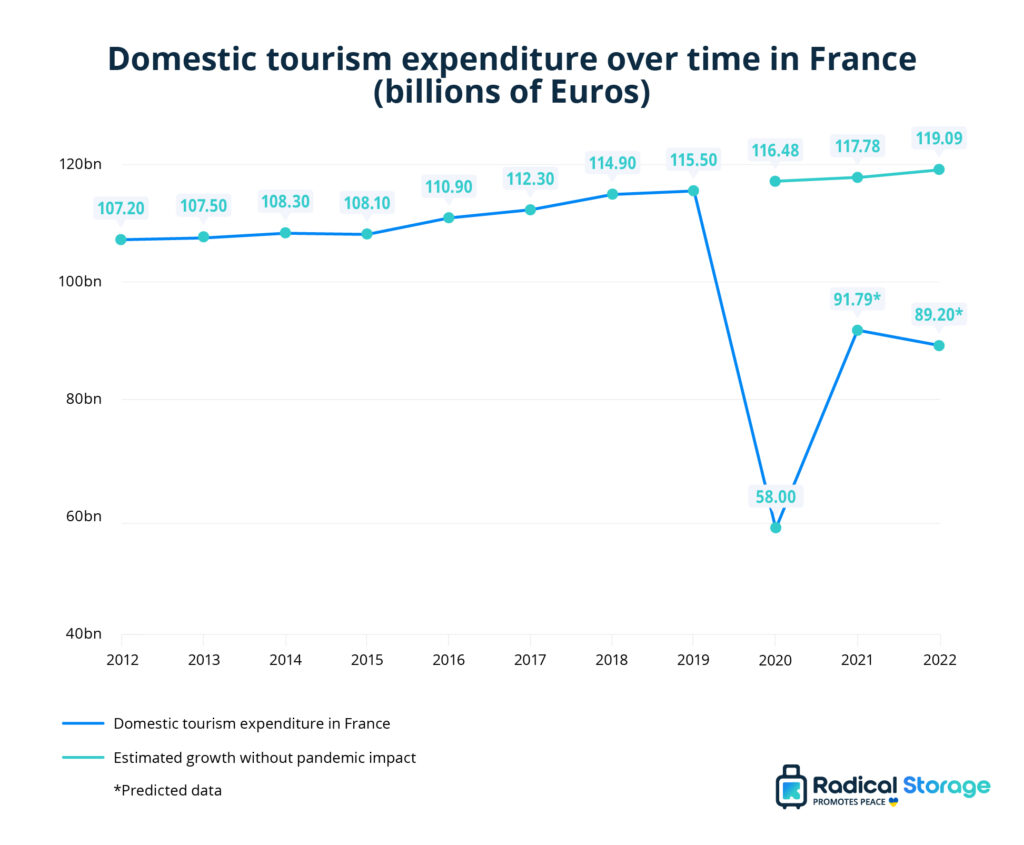
Of the 134.6 million domestic trips taken to destinations in France in 2020, 92.4% took leisure trips compared to 7.6% who took business trips.[8]
Tourist accommodation in France
The number of tourist accommodation options in France has remained fairly consistent since 2010. In 2021, there were 2.64 accommodation establishments, 101.2 rooms available, and 202.5 beds per 10,000 people in France.
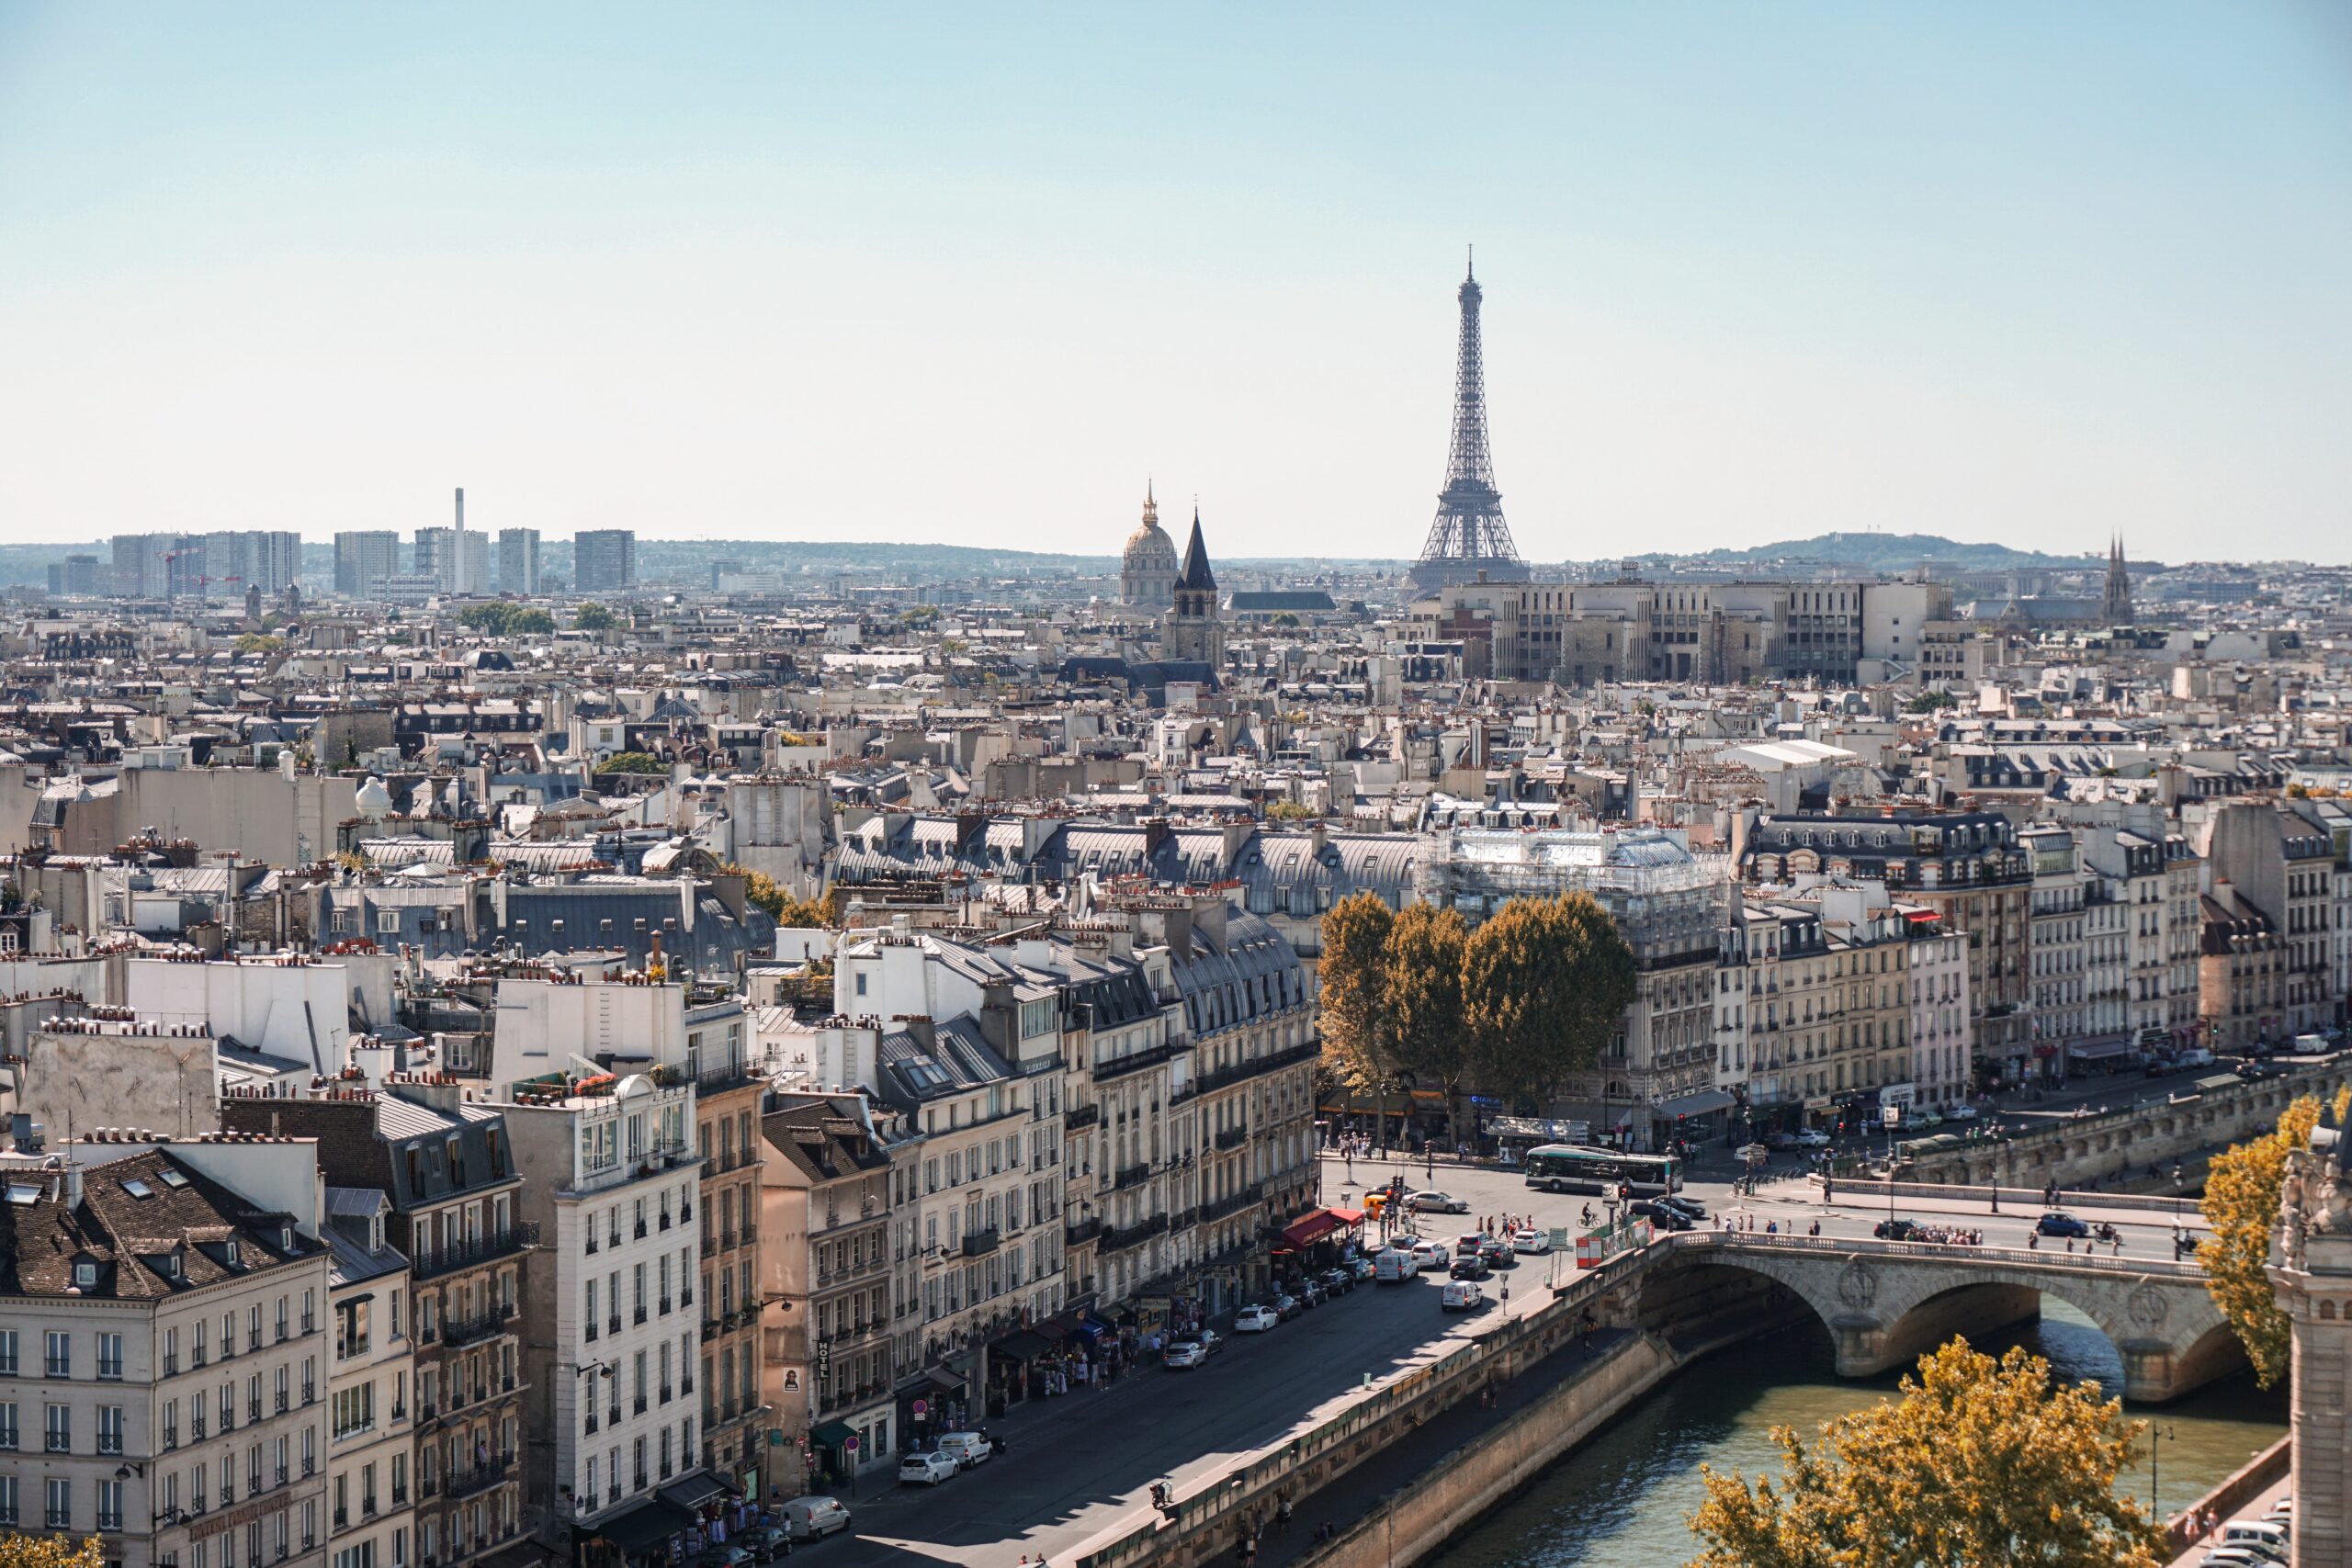
Paris tourism statistics
As the capital city of France, Paris is also the most visited city in the world, with Paris and the Île-de-France region hosting 44 million tourists in 2022.[10] It offers a huge choice of attractions, cultural sites including street art and historic monument, and events for visitors to enjoy.
Where do visitors to Paris come from?
The countries that the most visitors to Paris come from are:
- Belgium (11%)
- United Kingdom (10%)
- United States (9%)
- Netherlands (8%)
- Germany (8%)
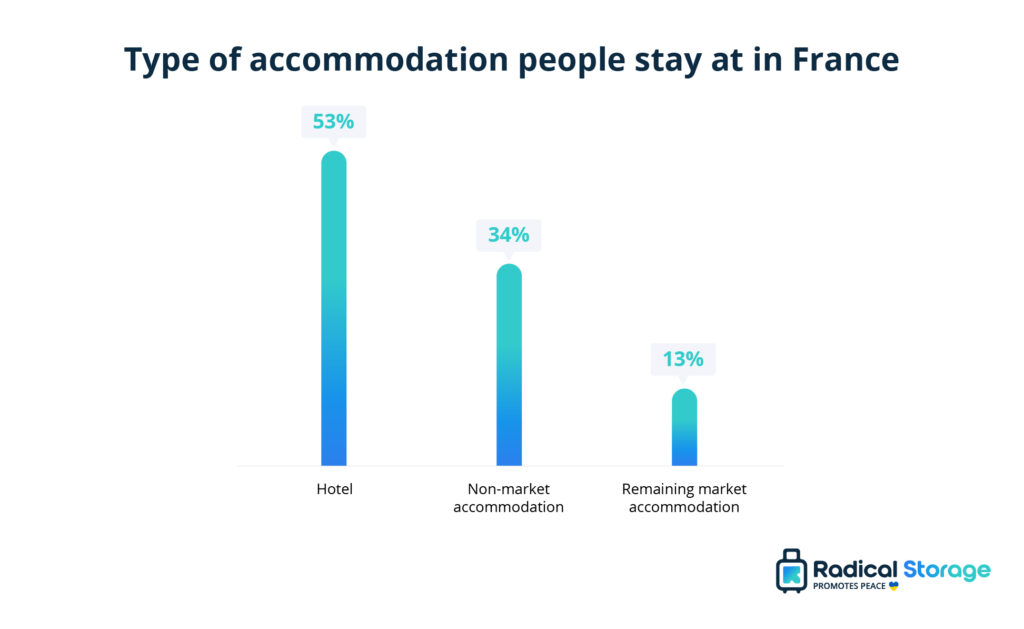
Accommodation tourists use in Paris
The majority of visitors to Paris (53%) stay at hotels when visiting for an overnight trip. 34% stay at non-market accommodations which includes Airbnb and other rentals, while the remaining 13% stay at other market accommodations such as apartments or hostels.
Average costs in Paris
On average, one person will spend €101 per day while staying in Paris.[11] The table below shows the average costs for food, drinks, and transport in Paris.
Did you know that Paris was ranked as the #1 destination for street food in 2022?
| Expense | Average cost |
| Meal, Inexpensive Restaurant | 15.00 € |
| Meal for 2 People, Mid-range Restaurant, Three-course | 60.00 € |
| McMeal at McDonalds (or Equivalent Combo Meal) | 10.00 € |
| Domestic Beer (1 pint draught) | 6.00 € |
| One-way Ticket (Local Transport) | 1.80 € |
| Taxi Start (Normal Tariff) + 1 mile | 2.80 € |
| Cappuccino (regular) | 3.04 € |
Most popular Parisian attractions by online mentions
There are several popular tourist attractions in Paris which see huge visitor numbers every year. The analysis below shows the popularity of tourist attractions in France based on mentions of each attraction in Twitter and Instagram posts.
The most popular attraction in Paris was the Eiffel Tower with 24.8% of the social media mentions, followed by the Louvre Museum with 11% of the mentions across all tourist attractions in Paris.
| Attraction | Share of mentions on Twitter and Instagram |
| 1. Tour Eiffel | 24.80% |
| 2. Musée du Louvre | 11.00% |
| 3. Disneyland Paris | 9.40% |
| 4. Montmartre | 6.00% |
| 5. La Seine | 5.30% |
| 6. Cathédrale Notre-Dame de Paris | 4.00% |
| 7. Arc de Triomphe | 3.60% |
| 8. Paris Fashion Week | 3.50% |
| 9. Basilique du Sacré-Cœur | 3.00% |
| 10. Champs-Élysées | 2.70% |
| 11. Château de Versailles | 2.60% |
| 12. Moulin Rouge | 1.50% |
Sources
[1] UN: Global and regional tourism performance https://www.unwto.org/tourism-data/global-and-regional-tourism-performance
[2] Statista: Travel and Tourism France https://www.statista.com/outlook/mmo/travel-tourism/france
[3] French Government: Plan de reconquête et de transformation du tourisme https://www.diplomatie.gouv.fr/IMG/pdf/destinationfrance_cle0f5dc4.pdf
[4] Statista: Most Visited Tourism Attractions in France https://www.statista.com/statistics/1117144/most-visited-tourist-attractions-france/
[5] Eurostat: Trips by Destination Type https://ec.europa.eu/eurostat/databrowser/view/TOUR_DEM_TTHD/default/table?lang=en&category=tour.tour_dem.tour_dem_tt.tour_dem_tttc
[6] Memento de Tourisme: La Frequentation des Hebergements https://www.entreprises.gouv.fr/files/files/etudes-et-statistiques/chiffres-cles/memento-tourisme/memento-tourisme-2018-chapitre4.pdf
[7] Statista: Domestic Tourism Expenditure in France https://www.statista.com/statistics/644766/domestic-tourism-expenditure-france/
[8] Statista: Number of Domestic Trips by Type in France https://www.statista.com/statistics/1276815/domestic-trips-by-type-france/
[9] Macro Trends: France Population 1950- 2024 https://www.macrotrends.net/countries/FRA/france/population
[10] Brussels Times: Paris remains most visited city in the world https://www.brusselstimes.com/417329/paris-remains-most-visited-city-in-the-world-with-44-million-tourists-in-2022
[11] Visit Paris Region: Key Features of the Paris Region Destination https://pro.visitparisregion.com/en/tourism-statistics/annual-key-facts/key-figures-of-the-destination
[12] Numbeo: Cost of Living in France http://numbeo.com/
[13] Paris Digest: Tourism in Paris https://www.parisdigest.com/paris/tourism-in-paris-2019.pdf